
The Science Behind SnapshotNIR’s Hemoglobin View and its Benefits
Hemoglobin view is a key feature in SnapshotNIR’s imaging technology. Putting the power of diagnostic-driven wound care in your hands to advance tissue assessment in acute and chronic wounds.
What is the hemoglobin view?
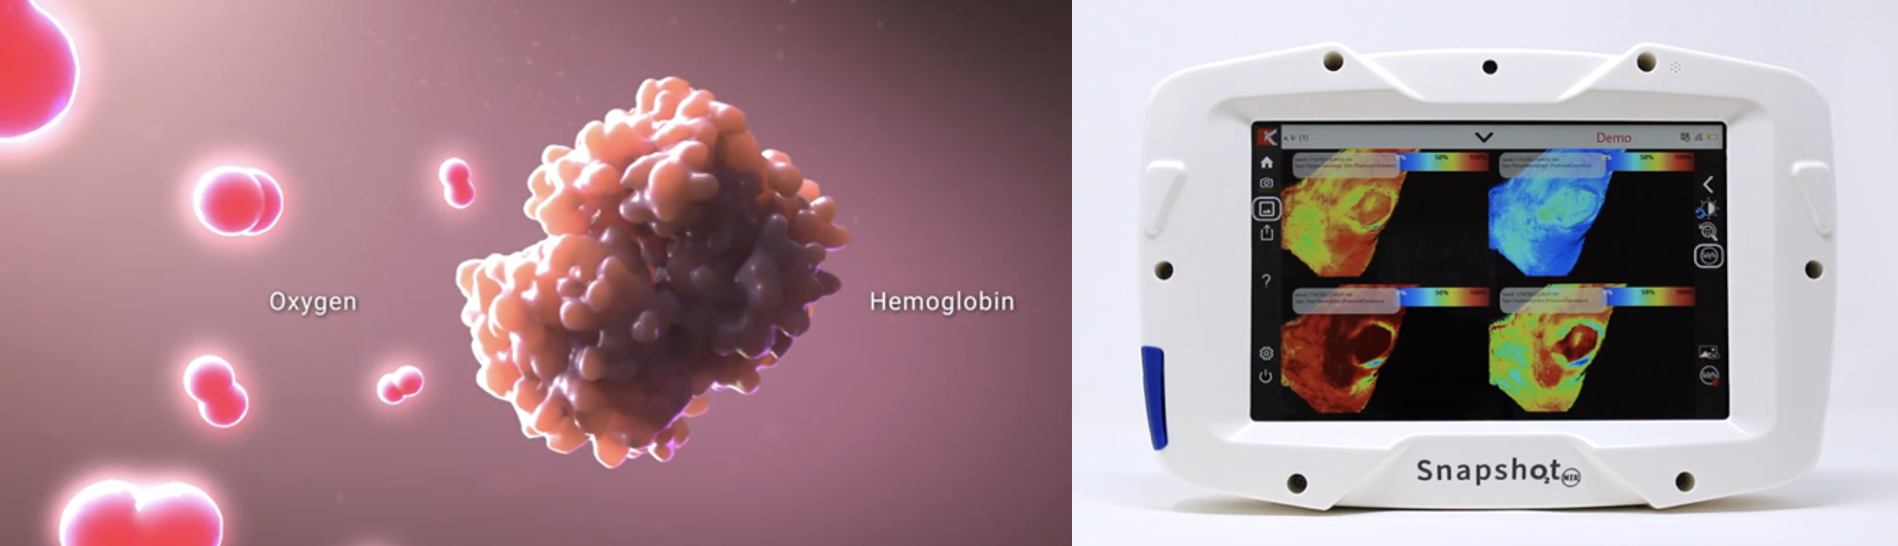
The hemoglobin view (HgB View) is a four-panel display on SnapshotNIR that provides the device user a visual representation of the variables that are used for the calculation of tissue oxygen saturation. These variables include the relative amounts of oxygenated and deoxygenated hemoglobin, the relative total hemoglobin (derived via the sum of oxygenated and deoxygenated hemoglobin) and the tissue oxygen saturation visualized at each image capture.
How does this work?
As blood circulates throughout the body, red blood cells each containing hundreds of millions of hemoglobin molecules bind to oxygen in the lungs and then release oxygen in the tissue. The amount of oxygen bound to hemoglobin is the tissue oxygen saturation. When this circulating blood travels through a capillary bed, oxygen diffuses from the oxyhemoglobin into the tissue. This causes a shift from oxyhemoglobin to deoxyhemoglobin at the level of gas exchange.
In HgB View, SnapshotNIR device users can utilize a range of sampling tools like those used in the tissue oxygenation (StO2) view:
Sampling from a standardized circle marker
Tracing a freehand region-of-interest marker
Linear and circumferential measurement tools
A feature in SnapshotNIR is the ability to adjust the image contrast within the hemoglobin view allowing device users to visualize the vasculature and perfusion characteristics within the tissues of interest.
What do you see in hemoglobin view that you would not see in StO2?
Tissue oxygen saturation (StO2) is a clinical metric derived from the direct measures of oxy- and deoxyhemoglobin. Using Hgb View allows the clinician to infer tissue oxygenation as well as tissue perfusion in multiple cases and conditions that patients may present with.
Tissue oxygenation provides insight into the metabolic health of the tissue showing how well the oxygen needs of the tissue are being met. For example, is a wound being perfused properly but suffering from a tissue metabolism insufficiency because of a burn, an infection, necrotizing fasciitis, or neuropathy? Might a trauma case been given high levels of saline to maintain blood volume at the expense of diluting the red cells and hemoglobin’s ability to deliver the required amount of oxygen to the tissue?
As tissue metabolic demand increases, oxygen is extracted at increased rates resulting in increasing deoxyhemoglobin, decreasing oxyhemoglobin and lowering oxygen saturation, and vice versa.
Alternatively, is the vasculature somehow compromised resulting in an insufficient tissue perfusion? We have visualized reduced total hemoglobin in addition to reduced oxygenation in models of vascular occlusion, mapping the location of increased vascular resistance or occlusion. Having multiple diagnostics available to the clinician increases confidence in the diagnosis as well as the nature of the disease. Each view has a unique perspective that synergistically can help inform patient care with accurate, actionable data.
For tissue metabolism, a certain amount of oxygen is needed. Using hemoglobin view, the deoxyhemoglobin window can shed light onto how much oxygen is being extracted as the higher the amount of deoxyhemoglobin being detected, the higher the demand for oxygen is. Total hemoglobin also offers another insight; it can be used as a surrogate measure of relative perfusion. If you have a low total hemoglobin, there is relatively low amounts of blood that are going through a tissue while a high total hemoglobin suggests that there is a large amount of blood that is going through a tissue. Both insights differ from the StO2 view and provide even more valuable data into relative metabolic health (i.e., deoxyhemoglobin) and blood flow (i.e., total hemoglobin).
The overall value in using hemoglobin view is that it provides clinicians and health care professionals additional metrics, above and beyond the tissue oxygenation view. When paired with the ease of SnapshotNIR’s repetitive imaging abilities, users can quickly compare hemoglobin view images pre- and post- intervention, at the bedside and without touching the patient, to assist in determining the potential of successful healing trajectories, leading to positive outcomes.
“Hemoglobin view aids the clinician in seeing disease better. When disease is seen, it can be treated. Hemoglobin view with SnapshotNIR increases the potential for positive patient outcomes and quality of life, reducing the risk for complications and associated financial liability to hospitals and clinicians.”
- Karel J. Zuzak, Ph.D

Early intervention: Clinical image (left) and hemoglobin view images (right) of the wound tissue following the second HBOT session and 5-days post debridement.

6 months later: Patient was treated with negative pressure therapy, the application of one skin substitute, and 36 sessions of HBOT. You can see the decrease in oxyhemoglobin and the increase in deoxyhemoglobin. (Hgb view on the right - clockwise from top-left: tissue oxygen saturation (StO2 ), deoxyhemoglobin, oxyhemoglobin, and total hemoglobin.)
(Images courtesy Erin Buchness, MHL, BSN, RN)
When is it best to use hemoglobin view and in what applications?
Hgb View is beneficial in a very wide number of clinical venues. Arterial or venous insufficiency is one of the most used applications from current SnapshotNIR users.
For arterial insufficiency, you generally have an arterial stenosis which limits the amount of blood flow coming into a tissue. This in turn will look like a low total hemoglobin and high deoxyhemoglobin as all the oxygenated blood that is coming into the tissue is quickly diffusing into the tissue to reach metabolic demand and causing there to be an increase in deoxyhemoglobin.
Conversely, a venous insufficiency issue would be when blood is pooling within the capillaries but there is nowhere for it to go. In such cases, it is suspected that there would be an increased total hemoglobin amount with an increased deoxyhemoglobin amount as no new blood is entering into the capillaries. Whatever stagnant blood is there will predominantly convert from oxyhemoglobin to deoxyhemoglobin.
The direction each screen of hemoglobin view takes can add another piece to the diagnostic puzzle on where a problem might be occurring and how it might be able to be fixed.
“Many times, a vascular surgeon or invasive cardiologist will open the blood vessel to supply the wound area. SnapshotNIR can be used to determine if wound area blood supply has improved. Based on this information, we are able to determine if further vascular intervention is needed.”
- Dr. Jonathan Arnold, MD, ABPM-UHM, CWS-P