
Visualization of Wound Healing Progression with NIRS
SnapshotNIR uses NIR (Near-Infrared) light to determine tissue oxygenation saturation (StO2), one of the key indicators of tissue health. NIR light penetrates ~2-3mm into the tissue, making it ideal for microcirculation assessment, where oxygen exchange is happening. Key Publications in Wound Care covers some of the most up-to-date research on the use of Kent Imaging’s SnapshotNIR in the areas of wound care and limb preservation.

overview of the study
CLINICAL DATA
Background: Adequate tissue oxygenation is a critical step in achieving wound closure. Near-infrared spectroscopy (NIRS) oxygenation imaging has shown value in predicting wounds that have adequate oxygenation to heal. However, wound healing is complex, and oxygenation is not the only factor that impacts wound closure. The aim of this retrospective study is to identify patterns involved in tissue oxygenation and wound healing as well as predict which wounds may or may not heal.
Method: In this study, 25 patients with either diabetic foot ulcers or venous leg ulcers were examined retrospectively to determine if NIRS could be used to predict which wounds may or may not close. Wound bed and peri-wound oxygenation patterns were observed and classified, including correlation with both the clinical appearance and the NIRS images. Images of wounds that closed and those that did not were compared.

Figure 1.A Grade 4 wound. (A) Initial wound showed necrosis centrally. (B) The near-infrared spectroscopy image showed well perfused surrounding tissues, with about two thirds of the wound bed having 59% percent oxygenated hemoglobin (POH). (C) The 4 different selected regions within the wound bed showed there was an area where necrosis was obvious (9% POH), while other areas of the wound bed revealed 33% and 9% POH, and the dorsal rim of the wound was at 74%. (D) At 10 weeks after the wound was about 90% closed.
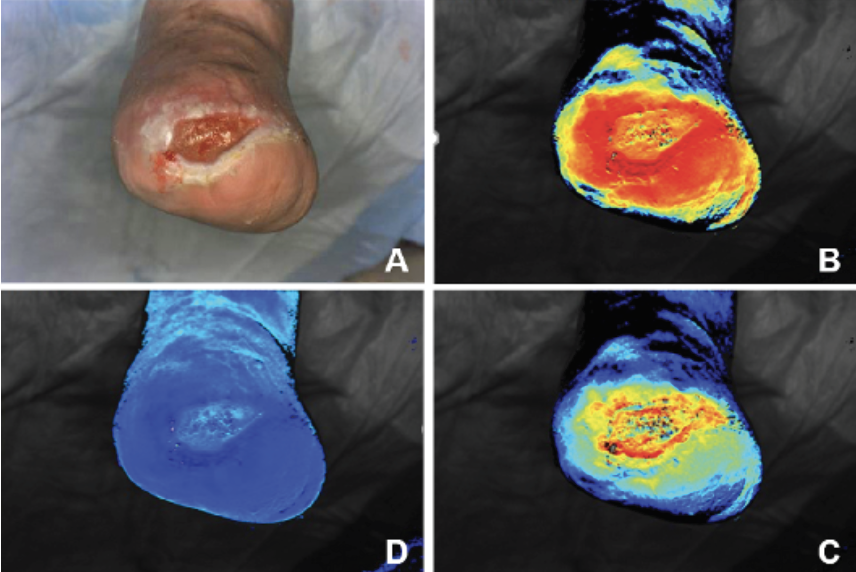
Figure 2. A Grade 3 congested wound. (A) Clinically, the wound showed granulation tissue in the wound bed and no obvious signs of infection. (B) Oxygen saturation view showed a strong, dense ring of red surrounding the wound, with a drop off in oxygen saturation over the wound itself. (C) At the deoxygenated hemoglobin view, it showed most of the hemoglobin in the wound area itself was deoxygenated (note the light area over the wound bed as compared with the surrounding tissues). (D) The oxygenated hemoglobin view had a strong ring of oxygenated hemoglobin surrounding the wound, with much darker areas centrally, showing the ratio of oxygenated to deoxygenated hemoglobin was much lower despite the fact that blood flow was getting into the wound bed.
Results: Four distinct patterns of tissue oxygenation that appeared to have some value for predicting which wounds would heal, and which would not, were identified among the 25 patients. A proposed mechanism to try to explain the patterns of healing observed are:

Hyperperfusion: This is the stage when StO2 buildup is seen around the wound bed. There is also a gradual darkening as the oxygenated blood moves toward the wound bed. The NIRS image will show a rim of bright red surrounding the wound bed.
Imbibition: In this stage, improved blood flow within the wound bed would be expected to be seen, as demonstrated by improved oxygenation in this area. This is the start of the exchange between blood surrounding the wound site and blood within the wound bed.
Neovascularization: In this stage, the interface between the wound bed and surrounding tissue becomes better perfused. The flow toward the wound bed from the far periphery begins to thin and the distinction between the wound bed and surrounding tissues becomes less defined. This creates a uniform field of oxygenation in the peri-wound areas that become less pronounced as the distance from the wound increases.
Trailing: This is the most obvious stage to observe the transition of a wound that will go on to heal. At this stage, the surrounding tissues appear to be normalizing, leaving behind wispy-appearing streaks and peaks surrounding the wound. These are expected to thin to virtually no bright red spots around 3 cm away from the wound in all directions.
Conclusion: As with any imaging technology, both qualitative and quantitative data are used to determine what is happening clinically. This study represents an early attempt to understand the role of NIRS and percent oxygenation in the wound healing process. It also lays the groundwork for identifying patterns associated with wound closure.
Citation: Adam Landsman DP. Visualization of wound healing progression with near infrared spectroscopy: a retrospective study. Wounds. 2020;32(10):265-71.
To view a wound care case study from Dr. Adam Landsman, click here.
To read more about the science behind SnapshotNIR and to watch an explainer video, click here.